Mapping water column content during bathymetry surveys
Suspended sediment concentration field from multibeam echosounders
Measuring suspended particulate matter in the water column is still a big challenge when it comes to covering large areas in the sea or rivers. A novel method to monitor particles in the water column over a wide spatial coverage is described here. It relies on the joint use of a hull-mounted multibeam sonar calibrated on site and an acoustic backscatter profiler working at multiple frequencies. The method is fast and easily applicable and offers great promise for retrieving large-scale information about suspended particulate matter in the water column in coastal areas.
The distribution and transport of suspended particulate matter (SPM) can impact the environment, from marine habitats and water quality to seabed morphology. Significant efforts have been devoted in recent decades to SPM monitoring at various temporal and spatial scales in coastal oceans and rivers. Systems typically used in SPM studies are the acoustic Doppler current profiler (ADCP) and acoustic backscatter profiling sensors (ABS). The multibeam echosounder (MBES) is however widely-used for bathymetry applications and can provide two-dimensional water column backscatter images over its swath. As such, MBES provides an opportunity to acquire SPM data in the water column with a better spatial representativeness than other acoustic systems such as ABS and ADCP.
Interpreting MBES measurements in terms of SPM remains intricate, however, due to complex MBES antenna designs, which require absolute calibration, and its sole emitting frequency (or at least limited frequency range in the case of multifrequency systems). Both issues can be overcome to achieve SPM quantification using MBES water column data, through the one-time calibration of the MBES antenna with a standard target and provided that measurements of multifrequency acoustic profiles are regularly repeated over time during the MBES survey. Here, a new fast and accessible protocol for SPM quantification using an MBES is proposed through an original field experiment.

Field experiment
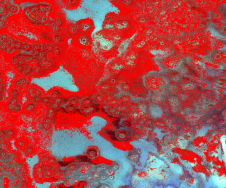
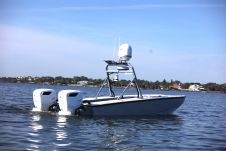
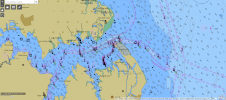
On 21 January 2015, an experiment was conducted from a small vessel under the Térénez bridge in the Aulne estuary, northwestern France (Fig. 1a). The Aulne river estuary is a shallow, macrotidal tributary of the Bay of Brest. The main minerals in suspension are philittic clays, which give the SPM the tendency to flocculate. The mass concentration of suspended sediment varies seasonally, with highest values observed during the winter flood (>1g/L).
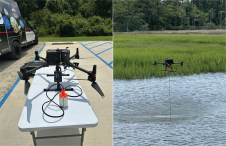
A Kongsberg EM3002 MBES at 300kHz was mounted on a pole, deployed from the vessel and surveyed the water column over five hours during ebb tide with a ping rate of 4Hz. The range sampling rate of the MBES was set to 15kHz, leading to a 5cm cell size (Fig. 2b). The raw backscattered signal arriving at the transducer was recorded and 81 beams were generated from -60° to 60° with a constant beamspacing of 1.5°. In addition, a total of 20 multifrequency ABS (Aquascat 1000S) measurements were collected, one each 15 minutes. The Aquascat measures the volume backscattering coefficient at four frequencies (0.5/1/2/4MHz) along 256 cells of 5mm for each ping, with a ping rate of 8Hz. The instrument was placed in a horizontal position, so that each profile could be averaged and assigned a particular depth. In situ water samples were collected using a Niskin bottle at the same time intervals and at a constant depth of 8m.

MBES ‘minimal’ calibration
The beamforming process of the EM3002 involves beam steering, which causes both differences in echo levels over the entire fan of the MBES and widening of the equivalent solid angle as the steering angle increases. In addition, a common constant bias in echo level to each beam exists. All these effects are generally corrected by calibrating each beam using a standard target or a controlled suspension. These protocols are time-consuming and require sizeable facilities. Instead, a field, semi-empirical calibration was designed, aiming at harmonizing the echo levels of the echosounder so that it can deliver absolute measurements over its entire fan.
The first step in the proposed SPM multibeam calibration consisted of correcting a single beam around nadir using a target (38.1mm diameter carbide tungsten sphere, Fig. 2a) of known material properties to determine the constant bias in the far field of the MBES in terms of target strength (TS). The differences in TS over the entire fan were then estimated theoretically from this single beam by computing the beam directivity patterns of the system as well as estimating the absorption and spreading. This resulted in a homogeneous measure of the absolute volume backscattering coefficient over the entire fan. There are too many unknowns for a single-frequency MBES to provide a direct SPM concentration for each beam from the information thus obtained, and multiple frequency information such as that provided by an ABS is therefore needed to determine the particle sizes. As the estimation of the SPM concentration and size requires a set of frequencies sufficiently spread in the range of 500kHz – 5MHz, it is not possible to use current multispectral multibeam systems and the ABS is required instead.

Suspension equivalent spherical radii (SESR) estimation and single-frequency MBES inversion
The ABS records the absolute volume backscattering coefficient at four frequencies. A total of 20 ABS profiles were inverted, yielding a numerical density distributed over 16 log-spaced equivalent spherical radius (ESR) classes ranging from = 30μm to = 500μm, at each depth sampled by the ABS (Fig. 3a). In this experiment, a backscattering model was designed to account for the current suspension properties using the Hydrac open source software. From the ESR, an equivalent radius of the suspension (SESR) was then estimated for a unique size class accounting for the whole suspension. The SESR were linearly interpolated to fit the MBES ping rate and the beam sampling depths. Uniform extrapolation was applied to the deepest bins in the column when those bins did not cover the MBES profiling range.

MBES backscattered intensity inversion
Figure 3b illustrates the SESR found for each depth cell. SESR ranges found were from 70μm to 170μm and appeared to be continuously increasing throughout the experiment.
Figure 4 represents the inverted time series of the MBES signal for the central beam along the water column as well as a comparison between two beams at 0° and 30° and the in situ observations from the Niskin bottle at a fixed depth of 7.75m. The estimated mass concentration increased from 07:00 (ebb start) up to 09:30. After 09:20, a moderate turbidity event occurred, with concentrations reaching 600mg/L. After 10:30, the concentration decreased to ~100mg/L, still showing a well-marked gradient near the bed. The spatial pattern of MBES mass concentration estimates and its evolution over time (Fig. 4b) are in good agreement with the mass concentration variations determined from water samples.
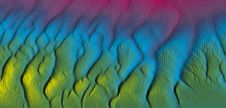
Finally, Figure 5 shows the mass concentration on six consecutive echograms. A clear contrast can be observed near the riverbed, where a higher concentration layer slowly set up before 09:20 from the port side of the echosounder (Fig. 5a). Despite some calibration artefacts visible on the port side of the echosounder (from 10° to 30°), the echograms return good insight into the SPM concentration field dynamics.

Conclusions
The inversion of raw MBES data for the purpose of suspended sediment quantification is applicable to any study site once a consistent model describing the scattering properties of the target suspension is known, which is the case for marine sediments. The potential of MBES to quantify SPM over a large spatial coverage is demonstrated. Using the developed calibration protocol, the raw multibeam data can be converted into a harmonized reading over its measurement fan. The inversion results are in good agreement with in situ mass concentrations and give access to the temporal evolution of the two-dimensional mass concentration field. Once the MBES is calibrated, it gives an reading. If another site is to be measured, the same methodology can be applied. However, a backscatter model is then required for the correct type of SPM. This study confirms the interest in the use of active acoustics for SPM monitoring purposes and highlights the need to access raw water column data from commercial MBES systems.
Further reading
Fromant G, Floc’h F, Lebourges-Dhaussy A, Jourdin F, Perrot Y, Le Dantec N, et al. (2017). In Situ Quantification of the Suspended Load of Estuarine Aggregates from Multifrequency Acoustic Inversions. J. Atmos. Ocean. Technol., 34, 1625–43. https://doi.org/10.1175/JTECH-D-16-0079.1
Fromant, G., Le Dantec, N., Perrot, Y., Floc'h, F., Lebourges-Dhaussy, A., & Delacourt, C. (2021). Suspended sediment concentration field quantified from a calibrated MultiBeam EchoSounder. Appl. Acoust., 180, 108107. https://doi.org/10.1016/j.apacoust.2021.108107
Fromant, G., Hurther, D., Le Dantec, N., Lebourges-Dhaussy, A., Jourdin, F., Vergnes, A., Le Coz, J., Fischer, S., Pierrefeu, G. (2019). Hydrac open-source software, [source code] https://bitbucket.org/fromantgu/hydrac

Value staying current with hydrography?
Stay on the map with our expertly curated newsletters.
We provide educational insights, industry updates, and inspiring stories from the world of hydrography to help you learn, grow, and navigate your field with confidence. Don't miss out - subscribe today and ensure you're always informed, educated, and inspired by the latest in hydrographic technology and research.
Choose your newsletter(s)